THE FEDERAL BUDGET, MADE VISIBLE
Where your
tax dollars go.
A clear-eyed look at the federal government’s outlays, translated into one familiar note.
THE ANNUAL PICTURE
Every dollar, accounted for.
Social Security
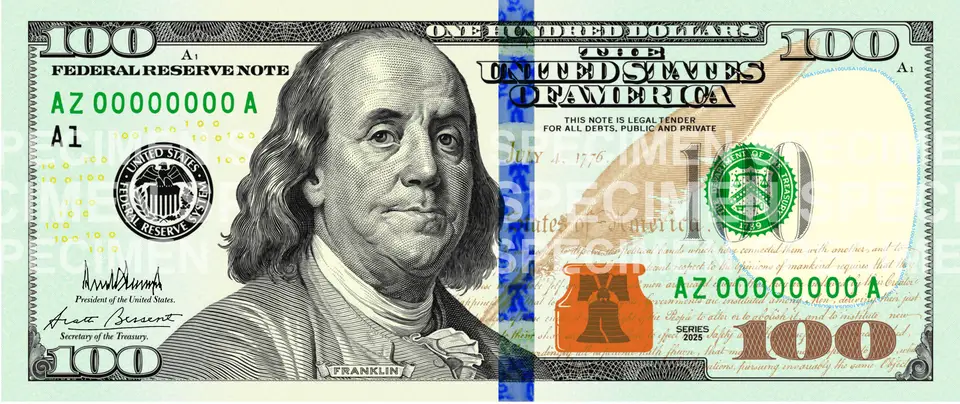
How to read this: this is an illustrative $100 allocation of fiscal-year-to-date federal net outlays by budget function—not a literal earmarking of each tax dollar. Figures come from the monthly statement, not real time. Some functions carry negative values (offsetting receipts, such as rents and royalties); those and smaller functions are combined into “Other and net offsets” so the note sums to exactly $100. This statement groups 12 functions there, 2 of them negative.
MTS RECORD DATE · SEP 30, 2026THE FUNCTION INDEX
The ledger, line by line.
Reporting period: FY 2026 to date through . Source: U.S. Treasury Monthly Treasury Statement, Table 9. Net outlays: $7,395,799,983,313. This is a dated monthly statement, not real-time spending. Without JavaScript, figures reflect the statement retrieved for this page’s build; newer statements require a rebuild.
ABOUT MYTAXDOLLAR
Big numbers.
A clearer picture.
Federal spending runs into trillions of dollars. Understanding it shouldn’t require a degree in economics.
MyTaxDollar turns official U.S. Treasury spending data into something familiar: a $100 bill. Each slice shows the relative share going to a purpose such as Social Security, health care, national defense, or interest on the debt. It’s a simple way to compare priorities without getting lost in the zeros.
Made for students, teachers, and anyone who’s curious, this free educational reference is a starting point for learning, asking better questions, and having more informed conversations about public money. Explore a slice, check its source, and build your own understanding.
MyTaxDollar is an independent project, not a government website or a statement of how your individual taxes are spent. Federal spending is funded by taxes, other receipts, and borrowing. The visualization shows spending proportions—not the full budget, a policy recommendation, or financial advice.
QUESTIONS, ANSWERED
Understanding
federal spending.
Where do U.S. tax dollars go?
Federal spending supports Social Security, Medicare, other health programs, national defense, income support, veterans, interest on the debt, and other public services. MyTaxDollar shows each category's share of reported federal net outlays as part of a $100 bill. These are spending proportions, not a tracing of your individual tax payment.
Where does MyTaxDollar get its data?
The spending allocation uses actual fiscal-year-to-date net outlays by budget function from Table 9 of the U.S. Treasury's Monthly Treasury Statement. The separate daily cash figure comes from the total operating-cash withdrawals row of the Daily Treasury Statement. Both are public Treasury Fiscal Data sources.
Is the spending chart updated every day?
The bill's proportions change when Treasury publishes a new Monthly Treasury Statement, not every day. The daily cash figure uses the latest published Daily Treasury Statement record, which can lag weekends and holidays. Each figure displays its own reporting date. Daily cash withdrawals do not determine the bill's slices.
What does each slice of the $100 bill mean?
Each slice represents a spending category's share of total fiscal-year-to-date federal net outlays. A category with a 20% share would occupy $20 of the illustrative $100 bill. Smaller categories and negative offsetting receipts are combined into Other and net offsets so the chart reconciles to the total.
Does the chart show exactly how my taxes are spent?
No. Federal spending is funded by taxes, other receipts, and borrowing. MyTaxDollar compares federal spending categories; it does not calculate your tax bill, trace individual payments, include state or local budgets, or recommend a policy. It is an independent educational project built by Homade, not a government website.
OPEN BOOK
Sources & method.
Note image: U.S. Currency Education Program, $100 note.
Each function's fiscal-year-to-date outlays are divided by total net outlays (line 340) to derive each function’s share. That share is mapped proportionally onto the note. Daily operating-cash withdrawals are a distinct cash-flow series and are never mixed into the allocation.